


 Scott Stouffer
Why Sales Forecasting Fails—and How to Fix It
If I had a dollar for every time I heard a CEO, CRO, or VP of Sales say, “We need better forecasting,” I’d have retired long ago.
Many companies' Go-to-Market (GTM) reporting and analytics are disconnected between the top-of-funnel and the bottom-of-funnel.
More often than not, Marketing leaders rely on the data generated from the marketing automation platform and analyze performance only up to the point a lead, qualified lead, or more recently a pipeline opportunity is created.
On the other hand, Sales leaders primarily focus on the bottom of the opportunity funnel data in the Customer Relationship Management (CRM) system and are agnostic on the top of funnel data such as lead source.
This disconnect between top-of-funnel and bottom-of-funnel data leads to many missed opportunities to optimize the Go-to-Market motion and deliver efficient, predictable and durable growth.
In contrast, full-funnel analytics provides revenue leaders with a holistic view of the funnel conversion process from website visitor to opportunity closure.
There are five significant benefits to leveraging full-funnel analytics:
Before we get into those five benefits, let's look at an example of Full-Funnel Analytics.
Consider the following simplified prospect journey resulting from a paid search campaign.
In an ideal world, all people who entered step 1 above would complete the entire buying journey in the shortest amount of time possible. However, in the real world, prospects withdraw from the journey at each step and there is often a material time lag between steps across the journey.
The proportion of people entering step 1 that ultimately conclude all 8 steps is known as the full-funnel conversion rate. The elapsed time to get from step 1 through step 8 is what we refer to as sales cycle length.
The movement from each step to the next also has its own conversion rate and cycle time such that the full-funnel metrics look something like the below table:
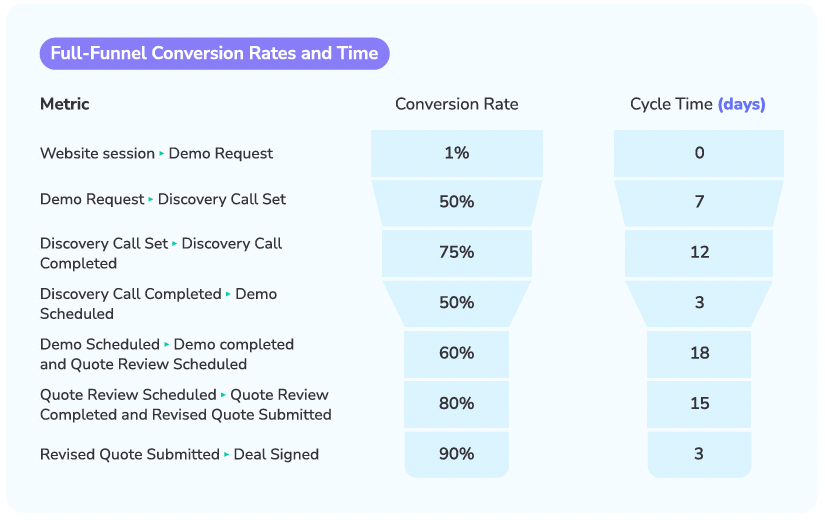
In this example, the overall funnel conversion rate from the point that someone clicks on a paid ad and shows up on the website to a deal being won equals 0.081% which is calculated by multiplying each of conversion rates.
This conversion rate implies that it takes ~1,235 website visits generated from paid search to yield one new customer.
The overall sales cycle in this example is 58 days which is calculated as the sum of each of the step specific cycle times.
A significant benefit of full-funnel analytics is the ability to forecast, or predict outcomes further in advance.
Forecasts by most companies today are derived from analysis of late stage opportunities in the pipeline. In the majority of cases, forecasting is done manually by aggregating every salesperson's view of what will close and when, and is then modified by sales management, based upon their own subjective criteria. In other cases, companies rely on forecast automation software that leverages historical opportunity closing trends to predict future outcomes.
It’s unclear whether one approach yields more accurate forecasts than the other. But in either case, the primary focus on late stage opportunities makes the time horizon of the forecast too short to be of any real value.
In other words, it’s too late in the process for companies to be able to react and change the expected outcome.
In the example above, current forecasting methodology would typically start when a demo had been completed and proposal review scheduled, which is nearly two-thirds of the way through the sales cycle.
Contrast that with the forecasting time horizon if you had robust full funnel analytics in place to confidently forecast sales multiple months from now based on the website sessions occurring today! In the example above, a conversion rate of 0.081% implies that 1,235 website visits today are required to generate a single closed won opportunity 58 days from now.
If your goals required you to close 3 opportunities in ~ 58 days then you would need ~3700 website visits today to generate those close-won opportunities.
If you were only at 1800 website visits, you could be relatively confident that you would fall approximately 50% shy of your goals.
Knowing this 58 days in advance actually gives you and your team time to react!
Full-funnel analytics enables revenue leadership to more quickly identify trouble spots in the overall customer acquisition process. Expanding on the example funnel above, consider the following analysis of actual performance vs. planned performance for a given month.
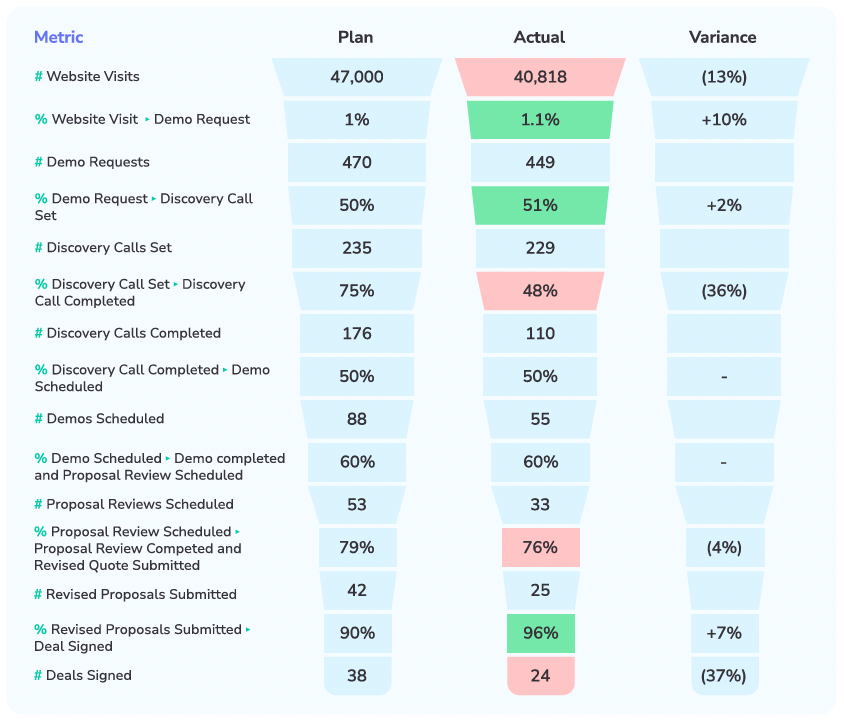
To analyze GTM friction, we typically look at the starting volume metric (i.e.# of website visits) and then each conversion rate metric between the starting volume metric and the ending volume metric (i.e. deals). In this example, the biggest variance relative to plan was related to a poor completion rate of Discovery Calls.
The plan assumed 75% of Discovery calls scheduled would complete, but the actual completion rate was only 48%.
The next biggest friction point was at the very top of the funnel with web traffic which came in at 13% less than plan. But the impact of that is only a third of the impact of the poor completion rate of Discovery calls.
From this simple example, it is easy to see the benefit of full-funnel analytics is how it helps leadership teams quickly focus their attention on the highest impact friction points in their full-funnel process.
Building a detailed plan (model) that identifies how a company intends to meet its goals is a crucial leadership activity for three reasons:
The problem is that most early, growth stage and mid-market companies do a less than adequate job at modeling out the plan to reach their goals at a sufficient level of detail.
Most often, companies translate their quarterly bookings goals into quarterly pipeline goals and then proportionally assign those pipeline generation goals out to Marketing, Sales and the Partner Channel.
That is not a plan. It is simply an assignment of goals.
For companies with a robust data-driven approach to full-funnel analytics, they are typically well positioned to build very detailed plans on how they will reach their goals.
In fact, the historical full-funnel conversion data often serves as the basis for future planning and modeling, positioning leadership to simply contemplate the impact of changing market conditions as well as new initiatives to model how future performance may diverge from historical performance.
A sufficiently detailed model and associated plan identifies each key funnel conversion metric from top to bottom for each calendar month for each major lead source that a company intends to invest in.
Note that we use the term sourcing strategy to mean “channels a company might invest in to gain exposure to and ultimately attract prospective new customers”.
These sources may include channels such as: paid search, paid LinkedIn ads, content syndication, referral sites, outbound SDR prospecting, channel partners, etc. These lead sources are different from content marketing assets such as e-books, webinars or research reports.
An example of the model for paid LinkedIn ads investment is shown below for six months.
|
LinkedIn Ads Plan |
Jan |
Feb |
Mar |
Apr |
May |
Jun |
|
#Website Visits from LI Ads |
10,000 |
10,500 |
11,025 |
11,576 |
12,155 |
12,763 |
|
%Website Visits => Demo Request |
1% |
1.01% |
1.02% |
1.03% |
1.04% |
1.05% |
|
#Demo Requests |
100 |
106 |
112 |
119 |
126 |
134 |
|
%Demo Request => Discovery Call Set |
50% |
51% |
52% |
53% |
54% |
55% |
|
#days Demo Request => Discovery Call Set |
3 |
3 |
3 |
3 |
3 |
3 |
|
#Discovery Calls Set |
50 |
53 |
55 |
60 |
62 |
66 |
|
%Discovery Call Set => Discovery Call Completed |
75% |
75% |
75% |
76% |
76% |
76% |
|
#days Discovery Call Set => Call Completed |
10 |
10 |
10 |
9 |
9 |
9 |
|
#Discovery Calls Completed |
37 |
39 |
41 |
44 |
46 |
49 |
|
%Discovery Call Completed => Demo Scheduled |
50% |
50% |
50% |
52% |
52% |
52% |
|
#days Discovery Call Completed => Demo Scheduled |
1 |
1 |
1 |
1 |
1 |
1 |
|
#Demos Scheduled |
19 |
20 |
20 |
22 |
23 |
25 |
|
%Demo Scheduled => Demo completed and Proposal Review Scheduled |
60% |
60% |
60% |
60% |
60% |
60% |
|
#days Demo Scheduled => Completed and Proposal Review Scheduled |
12 |
12 |
12 |
11 |
11 |
11 |
|
#Proposal Reviews Scheduled |
11 |
12 |
12 |
13 |
14 |
15 |
|
%Proposal Review Scheduled => Proposal Review Competed and Revised Proposal/Quote Submitted |
80% |
80% |
80% |
80% |
80% |
80% |
|
#days Proposal Review Scheduled => Completed and Revised Quote Submitted |
15 |
15 |
15 |
15 |
15 |
15 |
|
#Revised Proposal/Quotes Submitted |
8 |
9 |
10 |
10 |
11 |
12 |
|
%Revised Proposal/Quote Submitted => Deal Signed |
90% |
90% |
90% |
90% |
90% |
90% |
|
#days Revised Proposal/Quote Submitted=> Deal Signed |
4 |
4 |
4 |
4 |
4 |
4 |
|
#Deals Signed |
7 |
8 |
9 |
9 |
10 |
11 |
|
Avg. Annual Contract Value (ACV) $ |
$10,000 |
$10,000 |
$10,000 |
$10,000 |
$10,000 |
$10,000 |
|
Total ACV $ |
$70,000 |
$80,000 |
$90,000 |
$90,000 |
$100,000 |
$110,000 |
Clearly, repeating this model structure for each significant lead sourcing strategy results in a comprehensive plan.
But the exercise to do so is well worth it as it aligns the revenue leadership team, codifies assumptions and provides essential context against which to evaluate actual performance and collaborate on initiatives to improve revenue outcomes.
As a side note, the value in building plans at this level of detail for each lead sourcing strategy is dependent on your ability to effectively attribute top-of-funnel records to the appropriate lead sourcing strategy and then maintain that lead attribution through the entire funnel process.
There is no perfect attribution methodology, but we have found what we refer to as multi-cycle attribution to be quite effective at isolating differences between the different lead sourcing strategies a business invests in.
This chapter is not meant to be a detailed explanation of lead attribution, but in essence, multi-cycle lead attribution acknowledges the fact that any given lead may initially engage in a buying journey multiple times, via multiple lead channels before they finally make a purchase.
Multi-cycle lead attribution methodology maintains history of each buying/sales cycle and attributes each to the lead sourcing strategy that kicked off that cycle (e.g. outbound SDR prospecting).
Related to the lead sourcing strategy and attribution discussion above, businesses that have an effective approach to lead attribution, combined with robust full-funnel analytics are better positioned to truly understand the ROI of any given lead sourcing strategy investment, but also the relative value of a lead, demo, opportunity etc. from one lead source to another.
Consider the simple comparison below between outbound SDR prospecting and paid search for a given quarter (for simplicity we ignore cycle times) using the below full-funnel analytics:
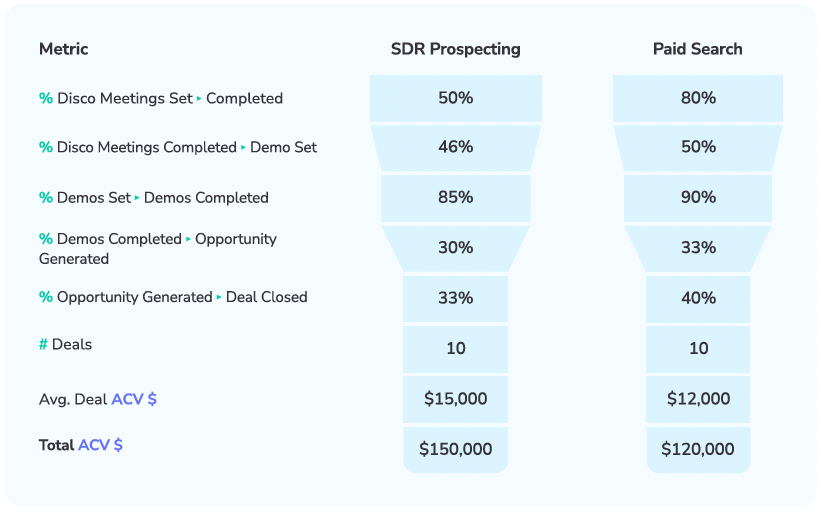
The funnel conversion rate from Discovery Meeting Set to Deal Closed for SDR Prospecting is 1.93%. This implies that you need 52 Discovery Meetings Set through SDR prospecting to yield a deal.
Given that the average deal size (ACV) is $15,000, this implies the value of a Discovery Meeting Set through SDR Prospecting is $288 (i.e. $15,000/52 meetings set).
The funnel conversion rate from Discovery Meeting Set to Deal Closed for Paid Search is 4.72%. This implies that you need only 21 Discovery Meetings Set through Paid Search to yield a deal.
Given that the average deal in this case is $12,000, this implies the value of a Discovery Meeting Set through Paid Search is $571 (i.e. $12,000/21 meetings set). This is nearly twice the value of a Discovery Meeting Set through SDR Prospecting.
Knowing the relative values and the associated costs to generate a Discovery Meeting through each of these lead sourcing strategies, the leadership team is now armed with the insights to allocate resources to maximize outcomes.
Similar to optimizing for lead sourcing strategies, full-funnel analytics positions revenue leaders to optimize for Customer Acquisition Cost (CAC) as well.
Consider the two Paid Search scenarios below - one focused on lead quantity and the other on lead quality:
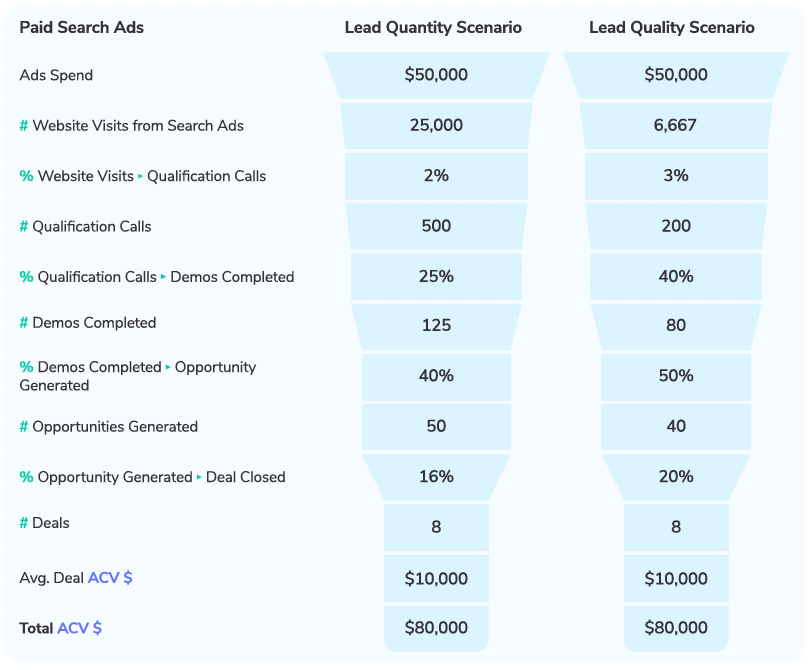
The two scenarios highlighted in the above table, while vastly different, yield the same final outcome – $80,000 ACV booked on $50,000 of paid ad spend.
Seemingly they have the same return on investment. They do, but only when viewed on the top-of-funnel investment.
A key difference in the two scenarios is the number of SDR resources required in the Lead Quantity Scenario to turn website visits in to Qualification Calls was four times (4x) the resource required in the Lead Quality Scenario, The SDR resources required to conduct the Lead Qualification Calls in the Lead Quantity Scenario was 2.5X the resources required in the Lead Quality Scenario.
The number of Sales (AEs) required to conduct Demos in the Lead Quantity Scenario was 1.56X the AE resources required in the Lead Quality Scenario. In addition, the number of AEs required to work Opportunities in the Lead Quantity Scenario was 1.25X that required to work Opportunities in the Lead Quality Scenario.
This massive difference between SDR and AE resources required to work the two scenarios makes it obvious that the Lead Quality Scenario has a far better return on investment (and lower CAC) than the Lead Quantity Scenario.
Yet without the benefit of full-funnel analytics, most Marketing leaders would opt for the Lead Quantity Scenario because it drives the highest volume of leads at the lowest cost per lead.
The case for full-funnel analytics is clear and compelling. While there is some effort associated with the instrumentation and cross-functional collaboration required to implement full-funnel analytics, the level of value it provides revenue leadership is profound.
It is fundamental to having the tools necessary to drive a highly efficient and predictable Go-to-Market motion leading to more efficient and durable growth.

If I had a dollar for every time I heard a CEO, CRO, or VP of Sales say, “We need better forecasting,” I’d have retired long ago.
.png)
Chief Revenue Officers are constantly looking for ways to maximize their sales performance and revenue growth. Sales cycle metrics are a key factor...

Spewing, hand-waving and back-pedaling. I can’t even count how many times across so many companies as CEO or Board member that I’ve asked questions...