

Your fastest path to accurate, full-funnel GTM analytics.
Instead of juggling spreadsheets, CRM reports & BI dashboards that have questionable underlying data...Try scaleMatters.
Built for Salesforce CRM users
Easy to setup - quick time to answers
Ends tedious reporting & analysis

.svg)

scaleMatters feels like getting extra headcount in RevOps, because this software is doing the analytical work of that extra person.
Dan Boscacci
VP, Revenue Operations @ Iodine Software


USING SCALEMATTERS...
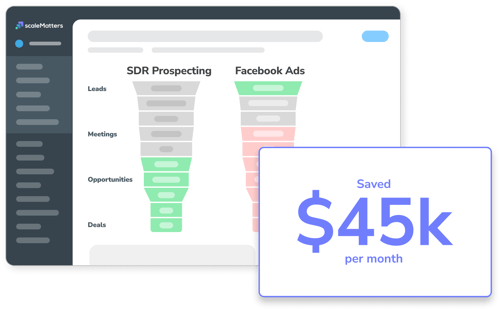
Series A software company discovered that low quality Facebook Ads leads were killing SDR team capacity - they saved $45k per month.

USING SCALEMATTERS...
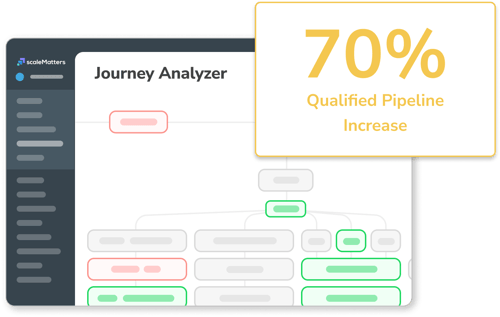
Global laboratory software company found and fixed a broken lead distribution process - increasing their pipeline by 70%.
USING SCALEMATTERS...
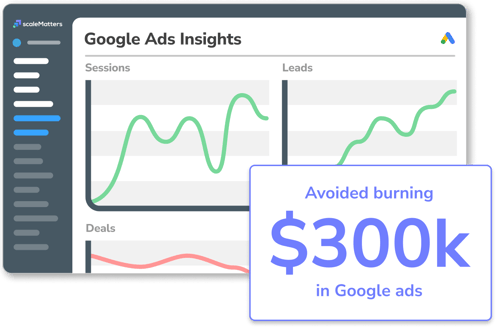
$200M CRM software company detected massive waste on new Google Ads strategy and avoided burning another $300k in quarterly ad spend.
Data Preparation PACKAGE
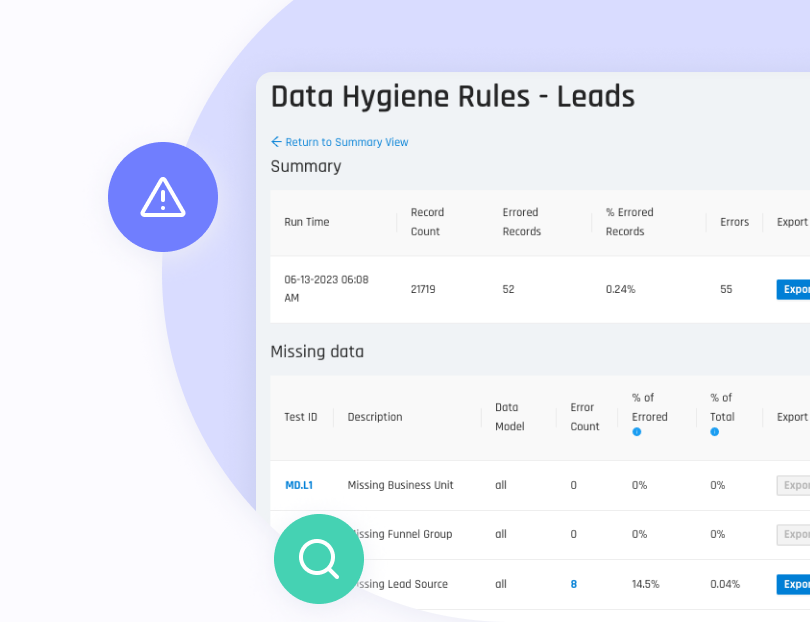
First, we get your data in good shape.
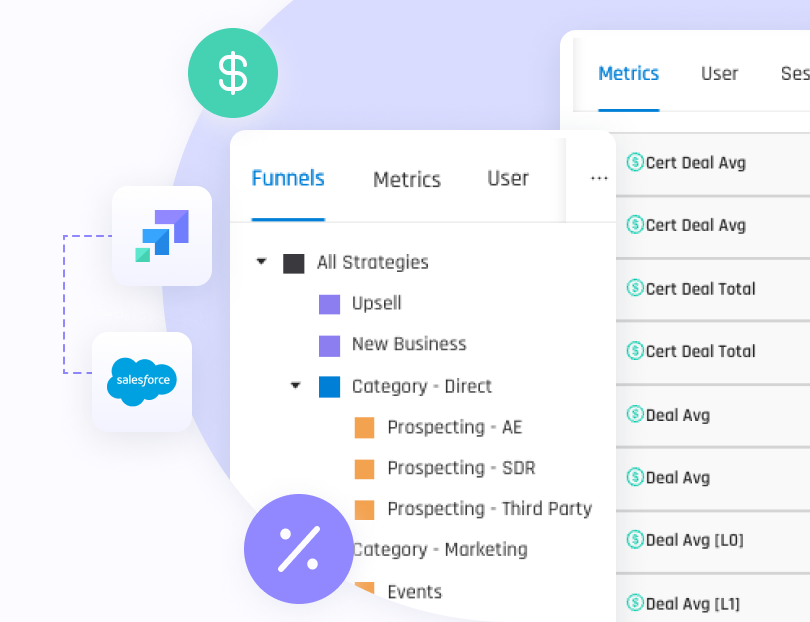
scaleMatters Data Prep Package is installed into Salesforce CRM making your funnel performance data ready for consistent, accurate analysis:
Captures every data point along your GTM process
Normalizes data from integrations (ex. HubSpot)
Pre-calculates key funnel performance metrics


GTM ANALYTICS SOFTWARE
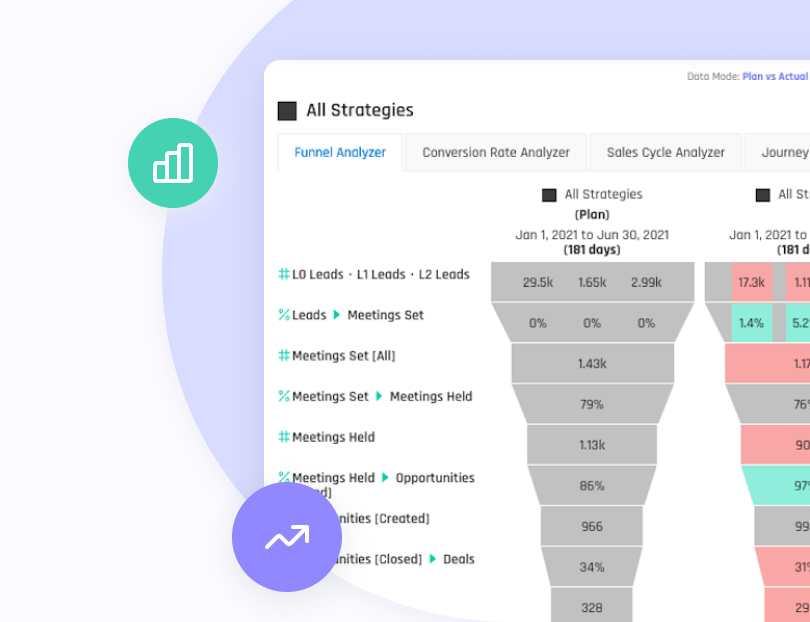
Then, we make your analytics always accessible.
Thousands of pre-built reports give you persistent visibility into revenue funnel performance and activities.
The sooner you learn what's working and what's not, the sooner you stop burning money OR double down on what's working!
Full-funnel analytics
Bottom-of-funnel sales pipeline analytics
Top-of-funnel marketing analytics

LEARN MORE
Ready to take your Go-to-Market reporting and your business to the next level?

Learn the 5 strategically significant benefits to leveraging full-funnel analytics...

Dial in precisely the right sales headcount to hit your revenue plan...

Analyze your revenue funnel using the right conversion rate calculation methodology...
