

 scaleMatters
CRO's Keys to Aligning Sales & Success in First 90 Days
2X Chief Revenue Officer and now President of Surefire Local, Mike Pierce, took some time out of his busy schedule to share important lessons, one of...
.png)
Chief Revenue Officers are constantly looking for ways to maximize their sales performance and revenue growth. Sales cycle metrics are a key factor in managing toward these goals, as it allows organizations to identify deficiencies within the full-funnel pipeline and optimize processes accordingly.
With the right KPIs, metrics, and analytics tools such as scaleMatters, Chief Revenue Officers can track progress against predetermined targets while managing their pipelines precisely. In this blog post, we'll explore four metrics for analyzing sales cycle performance that will help you optimize your Go-to-Market motion.
Sales cycle analytics are a powerful tool for Chief Revenue Officers (CROs) to measure and optimize their sales pipeline. It allows them to track key performance indicators (KPIs) in order to gain insights into the effectiveness of their sales team’s performance, as well as identify areas for improvement in their pipeline management processes.
When it comes to understanding sales cycle analytics, it's important to recognize that this type of analysis goes beyond traditional metrics such as customer acquisition cost or average deal size. Instead, it looks at the entire process from start-to-finish – from lead generation through close – and evaluates how each step impacts overall success. This enables CROs to pinpoint where they are falling short and make adjustments accordingly.
The benefits of using sales cycle analytics are numerous; most notably, it helps CROs better understand which strategies are working best and where improvements need to be made in order maximize efficiency and drive revenue growth. By leveraging data-driven insights derived from these analyses, companies can more accurately allocate resources while ensuring that goals are met on time and within budget. Additionally, tracking KPIs over time allows teams to stay ahead of trends by proactively responding when necessary rather than reacting after the fact.
Data-gathering tools exist to help CROs monitor every aspect of their sales cycle, displaying the results in a clear way for spotting trends and problems. Platforms such as scaleMatters also provide additional features like automated analysis of pipeline performance or predictive models that forecast potential outcomes based on current data points - both extremely useful resources for aiding CROs in achieving their KPIs while managing their pipelines with optimal efficiency.
At the end of the day, sales cycle analytics gives Chief Revenue Officers unprecedented visibility into all aspects of their customer acquisition operation- enabling them to not only track progress towards goals but also uncover potential problems before they become too big to handle. With its help, executives can ensure that they are making decisions based on sound data rather than gut instinct alone, ultimately driving greater ROI across all channels.
CROs can gain insight into their performance metrics and refine their commercial approaches by leveraging sales cycle analytics. Moving on, scaleMatters provides platforms and services that can help CROs effectively manage their pipeline while meeting those same goals.
Key Takeaway: Sales cycle analytics provide CROs with a comprehensive view of their sales pipeline, allowing them to track key performance indicators and make informed decisions based on data-driven insights. By leveraging the right tools for collecting and visualizing information about each step in the process, executives can ensure that resources are allocated optimally while staying ahead of trends by proactively responding to any potential issues before they become unmanageable.
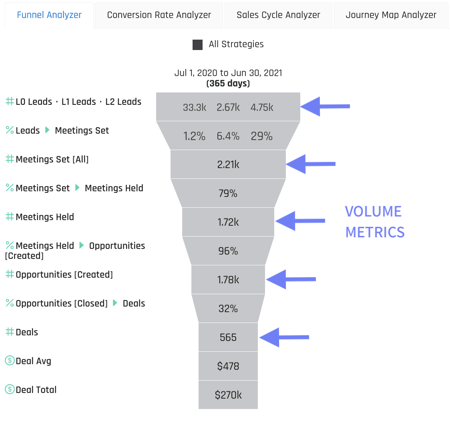
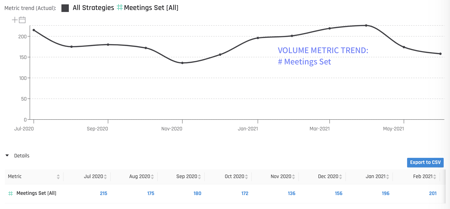
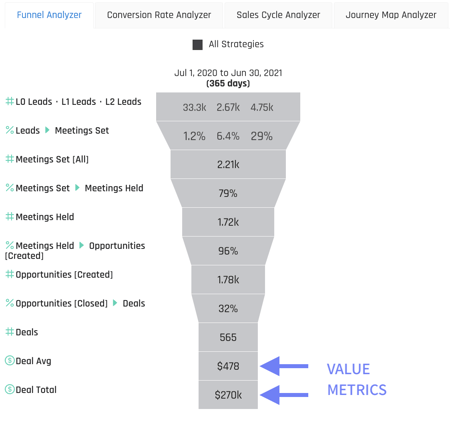
This is essentially the count or amount for any given metric during a given period. For example, volume metrics could be the number of meetings set in Q2 2023 or number of new opportunities added to the pipeline in July 2022.
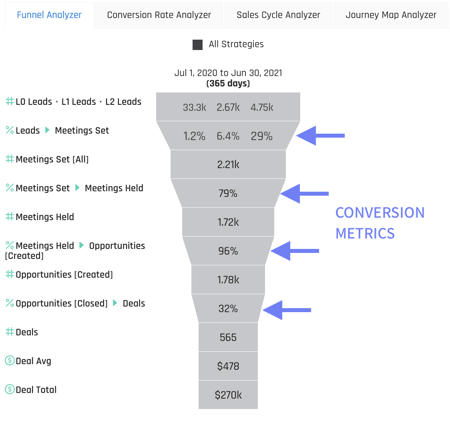
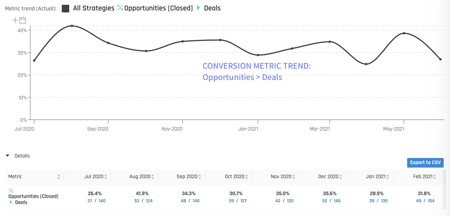
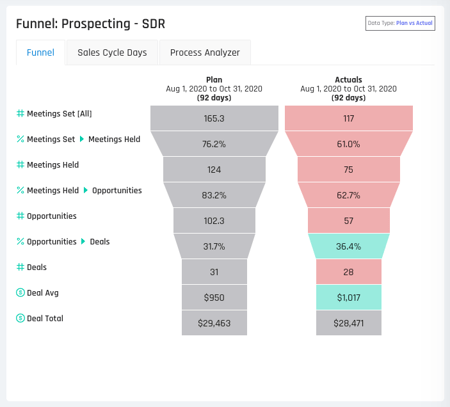
This measures the conversion rate from one step/stage to the next in the buyer journey. For example, the conversion rate % of leads created to meetings set might be 20%. It could also refer to the conversion rate between stages of the sales pipeline. The most common conversion metric is win rate which should be measured as a whole and broken up by individual seller, product, business unit, region, acquisition channel, etc.
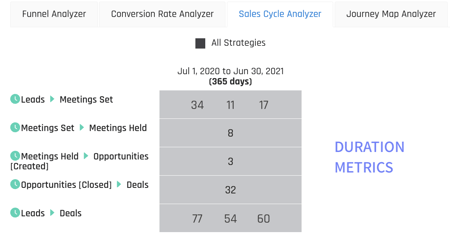
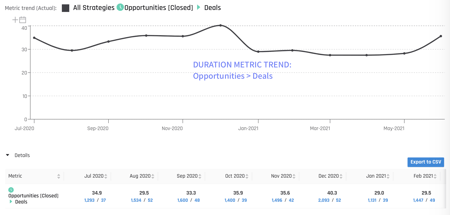
This measures the length of time it takes for a lead or pipeline opportunity to advance from one stage to the next. For example, the length of time between a Meeting Set and Meeting Held might be 3 days on average for a company. Duration metrics will vary by a number of factors including but not limited to:
-by sales person (one SDR might book meetings further in advance than others)
-by acquisition channel (inbound leads might choose meeting times that are sooner than outbound prospecting leads because there is more urgency)
-by product line (some products might have shorter overall sales cycles than others because they require more people to be involved in the meeting).
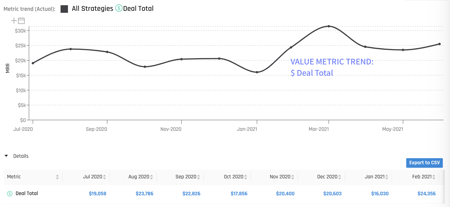
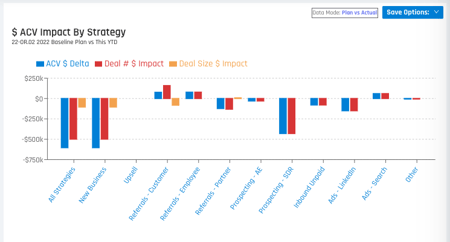
Value metrics are the dollar amounts that allow you to measure the ultimate success of your sales and marketing efforts. Value metrics include $ amount of pipeline created, $ amount of individual deals, $ amount of closed won opportunities in a given month, or $ deal size averages. Value metrics should be measured on aggregate and broken up to measure the individual performance of sellers, product lines, business units, acquisition channels, etc…
scaleMatters is a comprehensive GTM optimization platform that helps Chief Revenue Officers (CROs) track and analyze their entire customer acquisition key performance indicators (KPIs). By automating time consuming analysis, scaleMatters helps CROs rapidly identify deficiencies in their sales cycles and make informed decisions about resource allocation.
The secret sauce that scaleMatters brings that no other sales and marketing performance analysis tool offers is context.
scaleMatters infuses 5 elements of context throughout the platform to help make data actionable and help CROs prioritize highest impact issues throughout their entire pipeline.
These 5 elements of context in scaleMatters turn static reports and dashboards into actionable data insights.
scaleMatters platform offers several features to support the tracking and analysis of KPIs over time. It provides customizable dashboards (called Insight Panels) for visualizing data, enabling users to quickly spot trends or changes in performance over time. Additionally, it offers predictive analytics capabilities to provide insights into potential opportunities or risks before they occur. This helps CROs anticipate future outcomes based on current conditions and take corrective action as needed. scaleMatters includes historical trending over time, period-over-period analysis, and event annotations so you can correlate how changes you make impact performance over time.
scaleMatters’ reporting capabilities allow users to measure the effectiveness of their team's performance against predetermined goals and objectives set out by the company’s revenue plan. This allows them to gain insight into which areas are performing well and which need further attention so they can adjust accordingly while continuing on a path towards success. Upload your revenue plan/bookings model to scaleMatters to measure full funnel performance vs. plan, pinpoint variances to plan, and proactively course correct before it’s too late in the period to make a difference.
scaleMatters also enables users to drill down into individual sales cycles, allowing them to pinpoint areas where there may be room for improvement or increased efficiency. With this information at hand, CROs can then develop strategies for optimizing their pipelines by allocating resources more effectively or streamlining processes with automation tools. scaleMatters understands the upstream-downstream relationship between Go-to-Market process metrics. This makes it easy to spot root cause issues behind performance drops and helps identify the ‘why’ behind the ‘what’.
There will always be multiple areas in your Go-to-Market engine that need improvement, but you can’t fix everything at one time. scaleMatters adds weighting to metrics so you can focus on improving certain metrics that will have a bigger impact on revenue over others.
scaleMatters will aggregate and anonymize Go-to-Market data across companies with similar characteristics as your company, so that you can understand if your own performance for key metrics is a strength to exploit, or a weakness to overcome.
Overall, scaleMatters is an invaluable tool for helping Chief Revenue Officers achieve their goals through effective KPI tracking and analysis. It gives them the power to optimize pipeline management processes while driving revenue growth within their organization.
scaleMatters provides a comprehensive platform for tracking and analyzing KPIs, helping Chief Revenue Officers to stay on top of their sales performance. By employing key metrics to measure your team's effectiveness, you can gain invaluable knowledge on how well they are achieving objectives and where enhancements are necessary.
Key Takeaway: scaleMatters provides a comprehensive platform for CROs to gain insights into their sales performance and take corrective action through the analysis of KPIs. It enables them to identify deficiencies in their pipelines, optimize processes with automation tools, and measure progress against goals - giving them the power to drive revenue growth within their organization.
Measuring the effectiveness of a sales team's performance with KPIs is an essential part of driving revenue growth. KPIs can reveal how well your team is reaching their targets and enable you to recognize regions for advancement. Knowing which metrics to track and how to measure progress against those goals are key components in optimizing your pipeline management processes.
What Are the Most Important Metrics to Track? When measuring the effectiveness of a sales team’s performance, it’s important to look at more than just total revenue numbers or number of leads generated. KPIs such as win rate, average deal size, customer lifetime value, conversion rate from lead-to-close and time spent on each stage in the sales cycle are all valuable indicators that will give you insight into where your sales process may need adjustment or optimization.
All your sales performance metrics should be able to be segmented so you can answer questions about the health of your business.
Track all these sales cycle metrics:
How to Measure Your Team's Performance Against Your Goals? Once you have identified which metrics are most important for tracking success within your organization, it’s time to establish benchmarks for these metrics so that you can accurately measure progress towards achieving them over time. Setting clear goals and objectives around each KPI will help ensure everyone on the team understands what they need to do in order to reach their targets. Additionally, establishing regular review sessions with individual members or teams can be beneficial when it comes to understanding what strategies work best and why certain ones aren't successful.
Measuring the effectiveness of your sales team's performance with KPIs is an essential step to ensure that you are reaching or exceeding your goals. By leveraging data-driven insights and utilizing automation tools, you can optimize your pipeline management process for improved efficiency and accuracy.
Key Takeaway: Measuring a sales team's performance with KPIs is essential for driving revenue growth, and metrics such as win rate, average deal size and conversion rate from lead-to-close are key indicators to track. Establishing clear goals around each KPI will help ensure everyone on the team understands what they need to do in order to reach their targets; setting regular review sessions can also be beneficial when it comes to understanding which strategies work best.
Pipeline management is a critical component of any Chief Revenue Officer's (CRO) success. With the right strategies, CROs can leverage sales cycle analytics to optimize their pipeline and drive revenue growth. CROs can optimize their pipeline and boost revenue by pinpointing weak spots in pipeline management, using automation to simplify processes, and leveraging data-based insights for increased accuracy and efficiency.
To start off on the right foot with your optimization process, it’s important to identify potential weak points in your current pipeline management practices. This could include outdated or inefficient manual processes such as manually entering customer data into multiple systems or relying on paper documents rather than digital records for customer information. Once identified, strategies can be employed to bolster these areas of deficiency.
One way to do this is by utilizing automation tools such as scaleMatters' suite of services which help streamline many of the tedious manual tasks associated with capturing and analyzing sales pipeline data. Automation allows for faster processing times while also providing more accurate results due to its ability to quickly detect errors or inconsistencies within customer data sets before they become major issues down the line. Automation can also offer valuable insights into how customers interact with your offerings, allowing for more informed decisions about resource utilization and future growth strategies based on customer response.
By understanding the key metrics for sales performance, you can better optimize your pipeline management processes to drive revenue growth. By leveraging KPIs and sales cycle analytics, Chief Revenue Officers can develop strategies to monitor progress towards their goals and make informed decisions about resource allocation.
Key Takeaway: As an advanced CRO, it's important to leverage data-driven insights and automation tools to optimize your pipeline management process. This helps identify areas of improvement while also streamlining processes for faster processing times and improved accuracy when dealing with customer data sets. With the correct approaches in place, you can guarantee that your pipelines are running smoothly and proficiently.
When it comes to driving revenue growth, KPIs and sales cycle analytics are two of the most important tools available to Chief Revenue Officers. Establishing clear goals and objectives for each KPI is a crucial first step in leveraging these powerful tools. To track success in closing deals, it can be useful to set a target for the number of closed transactions over certain intervals, such as monthly or quarterly.
Developing strategies to monitor progress toward those goals is also essential. A CRO should look at both short-term metrics such as monthly or quarterly performance as well as longer-term trends over time when evaluating their team’s success. Gleaning insights from data can aid in making decisions on resource apportionment by rapidly recognizing places that could use more resources or benefit from efficiency gains. This type of analysis can also help pinpoint opportunities for growth within existing customer relationships and uncover new leads that could result in increased revenue.
By leveraging KPIs and sales cycle analytics effectively, Chief Revenue Officers can ensure they have the information necessary to make informed decisions about their teams' performance while managing their pipelines efficiently. This will optimize their efforts towards achieving desired outcomes, ultimately resulting in greater revenue growth for the organization overall.
By leveraging KPIs and sales cycle analytics, Chief Revenue Officers can create effective go-to-market strategies to drive revenue growth. Moving forward, we will discuss the conclusion of this project which outlines best practices for achieving success in sales performance metrics.
2X Chief Revenue Officer and now President of Surefire Local, Mike Pierce, took some time out of his busy schedule to share important lessons, one of...

Spewing, hand-waving and back-pedaling. I can’t even count how many times across so many companies as CEO or Board member that I’ve asked questions...
Go-To-Market strategy is a crucial part of any business, as it helps organizations to reach their target customers and generate revenue. It involves...