


 Scott Stouffer
Managing Go-to-Market Spend Like an Investment Portfolio
Most early and growth stage B2B startups squander precious time and expensive capital thrashing through sales and marketing approaches that...

Lifetime Value / Customer Acquisition Costs (LTV/CAC) has long been a foundational metric to indicate the quality and health of a SaaS company’s business model. It is intended as a simple proxy for unit economics of a customer, or how valuable each customer is to a given company.
Unfortunately, inconsistencies in the way companies measure LTV/CAC and its oversimplification in considering the time value of money and cost of capital render it essentially useless in real-life practice.
In spite of the rampant inconsistencies, investors continue to press their portfolio companies about LTV/CAC and founders/entrepreneurs continue to bandy this misleading metric. This leads to substantial miscommunication at best, and fateful decision-making at worst.
When calculating unit economics of a customer, the devil is in the details...
This article will show why, at a minimum, LTV/CAC measurements must be standardized for those who want to continue using that metric and hold it dear.
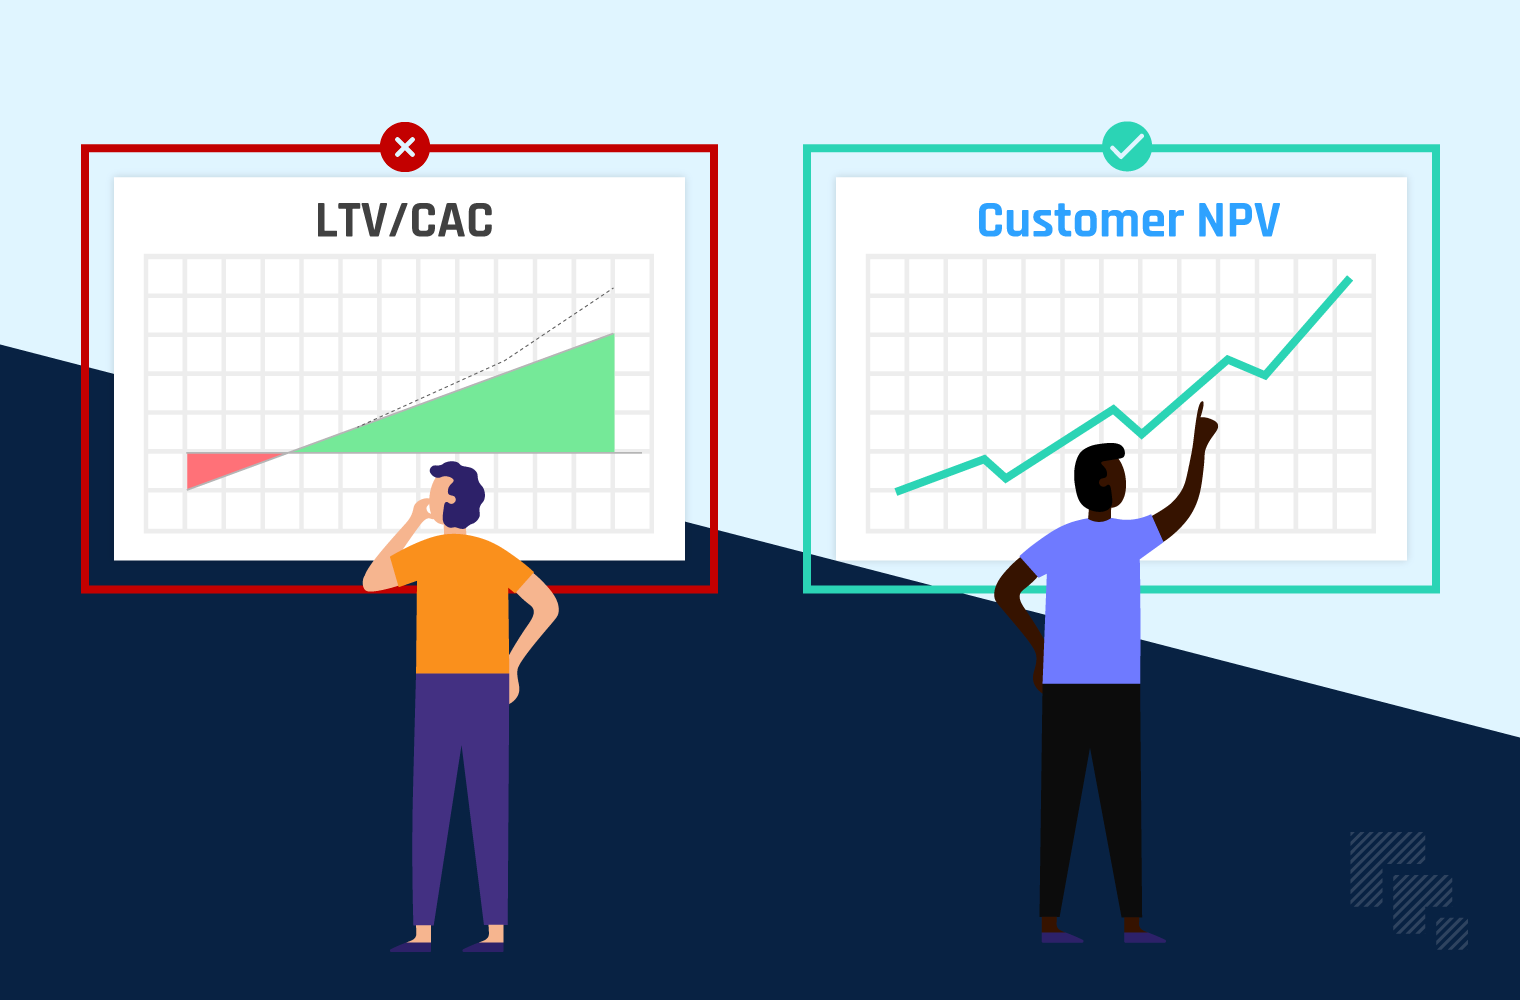
More importantly, I will share why LTV/CAC should actually be retired and replaced with Customer Net Present Value (NPV) as the most useful metric for determining the health of a SaaS company’s business model.
This article will appeal to long-game players... people who feel building a company for the long-term will maximize value at every stage of its evolution. Because long-game players are willing to take the time to develop true understanding. For those of you looking for the quick flip without regard to accountability of sustained value, save your time.
Let’s start with the presumption that creating value is the primary reason entrepreneurs start businesses and investors invest in businesses.
As a rule of thumb, growth drives value. I prefer to say that quality growth drives value.
Not only does it increase the economic value of an enterprise, it also provides massive opportunities for employee financial advancement and delivers meaningful economic impact in the community.
The distinction between growth and quality growth is itself related to short-term vs. long-term thinking.
Let me elaborate...
Until a tech company reaches a certain stage of maturity, growth is measured largely by top-line revenue, with little attention to profitability.
Witness the number of high-flying IPOs where companies are still losing hundreds of millions of dollars each year. ⬇️
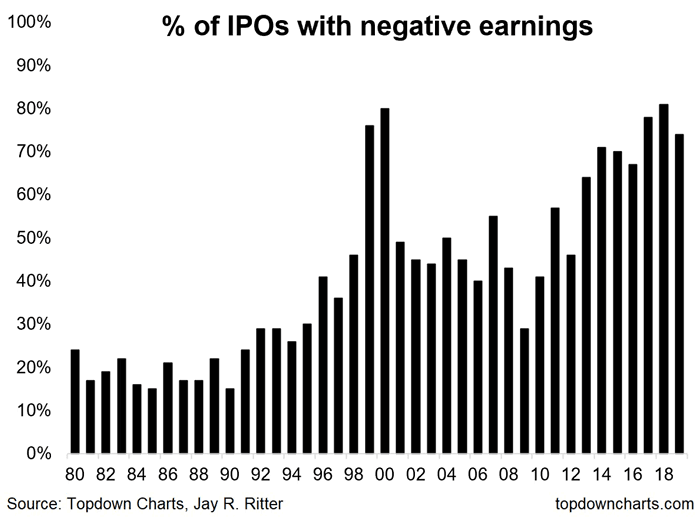
Photocred: https://www.isabelnet.com/of-ipo-with-negative-earnings/
This revenue growth is typically fueled by rapid new user or new customer acquisition growth.
There is an implicit assumption that high growth companies with attractive unit economics will eventually have more than enough customers to cover their operating costs and suddenly deliver massive profits to shareholders.
However, if the unit economics aren’t compelling on a per customer basis then this assumption is never realized and these companies just continue to hemorrhage money. Meanwhile, early investors have already exited the business with a hefty return and someone else is left holding the bag.
The LTV/CAC metric is intended as a proxy measure of unit economics, in other words what the value of adding an incremental customer is.
That’s why it is thought to be so important as an indicator of quality growth, or in other words, the sustainability of the business model.
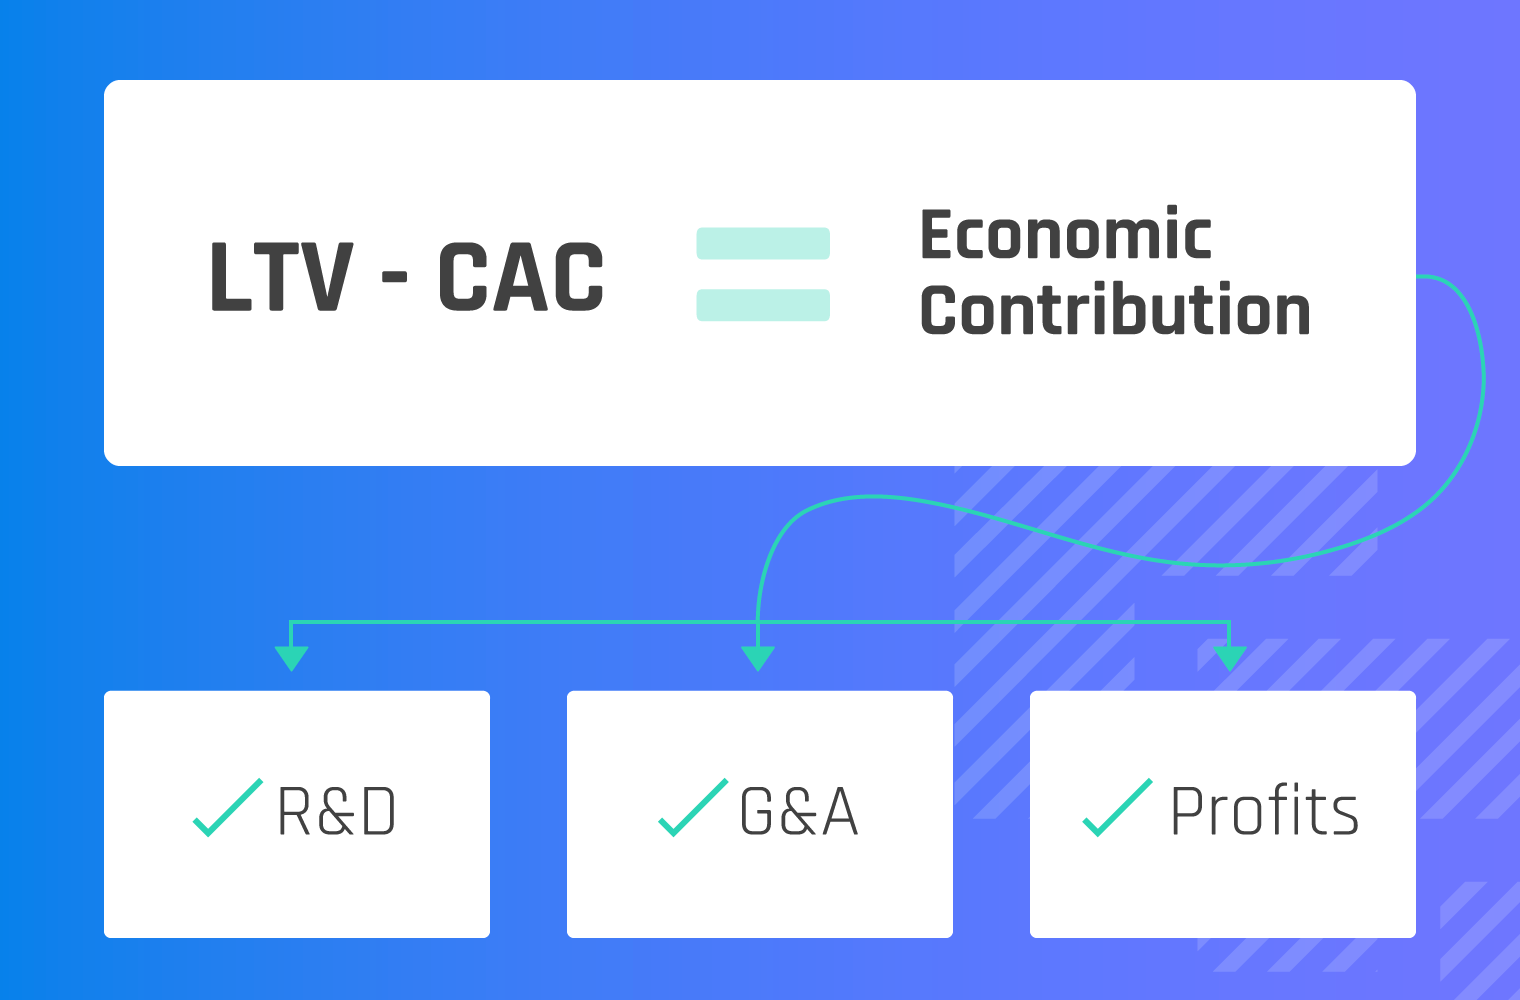
The concept behind LTV/CAC is simply this: the difference between the lifetime value of a customer and the cost to acquire that customer is the economic contribution that pays for R&D and G&A expenses but also delivers profits.
Put differently, [LTV - CAC = contribution for (R&D + G&A + Profits)]
OK. No issues so far. So why is LTV/CAC problematic?
When people quote LTV/CAC statistics without knowing exactly how LTV/CAC was calculated, there is no context to interpret it. One company’s LTV/CAC of 3 could actually be the same as the next company’s LTV/CAC of 6.
On the surface, there are seemingly only two components to this metric: LTV and CAC.
But, like I mentioned earlier, the devil is in the details and there are three major problems buried inside LTV/CAC calculations.
LTV is Lifetime Value. The first mistake people make is to consider LTV as some sort of revenue value. So they calculate LTV by taking the average annual recurring revenue (ARR) of their customers and divide that by the annual churn rate.
But that measurement would ignore the costs associated with supporting the customers (e.g. support, customer success, cloud server costs, etc.).
The correct way to measure LTV is on a gross margin basis, not a revenue basis. Which begs the question of how to calculate gross margins or more specifically what should be included in cost of goods sold (CoGS).
There are many different approaches to calculating CoGS. Our preferred approach for SaaS companies is to include any expense (other than billing/collections) that wouldn’t exist if you didn’t have any customers.
This approach to calculating CoGS includes the staff and technology costs associated with the production environment on which the software runs and also includes the staff and technology costs associated with implementing, onboarding, training and supporting customers.
The murkiness arises around how to treat staff costs associated with renewals and up-sells. In some organizations, this resides in the Customer Success function. In other organizations it can be found in the Sales function.
Our view is that staff expenses around renewals and up-sells should be included in CoGS.
Accordingly, the churn rate that should be used is net ARR churn. This way, all expenses associated with minimizing net ARR churn are included in CoGS and not treated as part of CAC.
Generally, your customers who don’t churn actually increase how much they will spend on your solution over time. For most companies, the average ARR across all of their customers is higher than the initial ARR at the time the customer is booked.
But since the churn rate we are using is net ARR churn, it needs to be applied against the average starting ARR when customers are booked, not the average ARR across all customers regardless of when they were booked.

LTV = Gross Margin1 % x ARR2 / Churn3
CAC = all staff and related expenses associated with acquiring new customers expressed on a per customer basis.
Now that we've established a proper, consistent way to measure LTV/CAC, I'll show you why that metric STILL comes up short as a proxy for customer unit economics.
SaaS/subscription models are unique because they require companies to invest upfront to acquire a customer, but then defer the revenue stream from that customer out over time.
In order to truly understand the unit economics of a customer you should perform a net present value (NPV) analysis which essentially discounts future cash flows by the time value of money in order to calculate a present value of those future cash flows.
To calculate NPV, you’ll need to know the following:
The most generic concept of time value of money is related to inflation. We all understand that if inflation is 2%, then $100 a year from now will only have the same buying power as $98 today.
But, when we consider NPV calculations in the context of this article we need to use expected returns on invested capital as the discounting factor for time value of money, because the expectation is that you must provide those returns to investors prior to making any profit for the company.
Expected returns vary widely based on your stage of growth as that tends to determine your most likely source of financing.
Consider the table below as a simple rule of thumb for expected returns based on source of capital:
|
Source of Capital |
Expected Annual Return |
|
Seed/Early Stage VC |
30% |
|
Growth Stage VC |
25% |
|
Lower Market PE |
20% |
|
Venture Debt |
12% |
|
Traditional Bank Debt |
7% |
|
Blended Cost of Capital* |
20.3% |
*Blended Cost of Capital assumes 30% of your capital comes from Seed/Early Stage VC, 30% comes from Growth Stage VC, 20% from Venture Debt and 20% from Traditional Bank Debt.
This is also why your terms around payment frequency matter so much. The more revenue you can collect upfront, the more valuable a customer is because deferred payments are depressed by the compounding effect of expected returns.
To illustrate these points, let’s use the following metrics for our example NPV calculation:
Below are summary results of our example NPV calculation. Please see the accompanying NPV Calculator model spreadsheet for full results.
|
Source of Capital |
LTV/CAC |
Cost of Capital |
NPV @ Monthly Payment* |
NPV @ Quarterly Payment* |
NPV @ Annual Payment* |
|
Seed/Early Stage VC |
5.0 |
30% |
($2,899) |
($2,383) |
$64 |
|
Growth Stage VC |
5.0 |
25% |
($832) |
($345) |
$1,941 |
|
Lower Market PE |
5.0 |
20% |
$1,839 |
$2,288 |
$4,375 |
|
Venture Debt |
5.0 |
12% |
$8,099 |
$8,451 |
$10,067 |
|
Traditional Bank Debt |
5.0 |
7% |
$14,001 |
$14,252 |
$15,393 |
|
Blended |
5.0 |
20.3% |
$1,657 |
$2,109 |
$4,209 |
* All NPV calculations are limited to 180 months
These summary results show six different cost of capital scenarios. In each scenario the LTV/CAC metric is equal to 5.0, but they have wildly different customer unit economics.
This illustration disproves the theory that LTV/CAC is the best proxy for customer unit economics and it reinforces two principles that were never in question:
We’ve already proven that comparing LTV/CAC metrics without context of cost of capital is meaningless, but understanding the component make-up of LTV/CAC is also important context to interpret relative LTV/CAC results.
Let’s consider three businesses with unique LTV/CAC compositions, all which equal 5:
|
Business #1 |
Business #2 |
Business #3 |
|
|
Avg. ARR |
$10,000 |
$10,000 |
$10,000 |
|
Gross Margin % |
75% |
75% |
75% |
|
Annual Net ARR Churn % |
10% |
5% |
15% |
|
CAC |
$15,000 |
$30,000 |
$10,000 |
|
Calculated LTV/CAC |
5.0 |
5.0 |
5.0 |
Now, let’s look at the true customer unit economics for each of these businesses. For simplicity, we will assume that all of them use monthly payment terms for their customers and they all have a blended cost of capital of 20.3%.
|
Business #1 |
Business #2 |
Business #3 |
|
|
NPV of Customer |
$1,657 |
($10,776) |
$4,657 |
The implication here is that minimizing CAC has the strongest impact on customer unit economics. And that makes complete sense, because you incur CAC upfront so CAC isn’t impacted by time value of money.
LTV/CAC as a simple proxy for customer unit economics and therefore as a test of business model quality simply does not work because of a vacuum of context. For it to work, one would need a set of “actuarial” tables to find the minimum viable LTV/CAC given your cost of capital, your payment terms, your gross margin, your churn and your CAC.
Quite frankly, it’s easier to use the real thing, which is Customer NPV. It paints an accurate picture whereas context-free LTV/CAC tells us nothing at best and the wrong thing at worst.

Most early and growth stage B2B startups squander precious time and expensive capital thrashing through sales and marketing approaches that...

A grueling part of the venture capital or private equity fundraising process is the due diligence phase. Potential investors will typically open up...

Congrats! You just raised a sizable Series A round. Now what? Your company is moving from a founder-led approach for acquiring customers to a...